I don’t know who needs to hear this, but those of you working in marketing or category management are often doing it wrong.
But it’s not just you. It’s the whole culture that supports the notion that you will hit upon some valuable conclusion or the next great business idea by wading through big data, dashboards and PBIs.
I’m here to tell you why that’s a fallacy. But first, I’m going to talk about smallpox. Stay with me. It’s relevant, I promise!
In Europe, smallpox killed three people out of ten for centuries and up to 95% of indigenous populations in the Americas. The medical establishment felt powerless until a British doctor called Edward Jenner came along and, instead of wondering why people were dying, asked why some people weren’t dying from the disease.
Question the question
The answer turned out to be something to do with milkmaids and cows. I won’t get into the details now, but this example illustrates just how important it is to formulate the right question, regardless of whether you’re trying to stop a menacingly deadly disease or increase sales of mango yogurt.
It’s a question of maximizing not only your creativity in pinpointing the correct way into the problem, (i.e., the query) but also your logical thinking.
When business is down and panic is up, the knee-jerk reaction is to wonder why you’re losing market share. But the question–and not the only one–you probably should be asking is: who are you losing market share to? In other words, who is growing and what behaviors are generating that growth?
Let’s look at your mission statement. You’re tasked with understanding the competitive landscape of your brand or product and uncovering insights that will move the businesses forward. Sounds great. But you are so utterly overwhelmed by all the data available that you’re lost in the fog of analysis paralysis. You can’t make a decision for fear of making the wrong one.
Cut to the chase using self-service AI-empowered analytics
Thanks partly to rapid advancements in technology and the increasing need to make decisions that are data-driven, AI-empowered self-service analytics is having a moment. Well, more than a moment; it’s providing everyone with the tools they need to access information and generate insights, increasing efficiency while cutting the IT and data teams some slack.
This puts you on surer footing and takes your organization one step closer to success. But how?
I’m going to break it down with science. Because if we want to gain innovative ideas and solutions from our data, we need to adopt the classic five steps of scientific research. Let’s examine how scientific methodology can be applied to our own processes to streamline the decision-making process.
Five Steps to Avoiding Paralysis by Analysis
Step 1: Define a question to investigate
When scientists conduct research, they make observations and collect data. These two activities lead them to question why something is it the way it is. Once scientists have a good question, they can brainstorm ways to answer it.
Similarly, you need to interrogate what your question is: what is it you need to clarify? Self-service AI-empowered analytics can already help at this point, as it can generate a wide range of questions for you to choose from.
Perhaps you’re a brand manager for a juice category, for instance, and have decided to launch a new flavor. The most popular flavors are apple and orange, so you decide to launch an apple-orange mix. What’s the right question to ask? What should the price be? What size should the package be? Will the category grow or decline as a result of the launch? Or maybe we need to ask a completely different question, such as: how can we grow the category without launching anything at all?
Step 2: Make predictions
Based on the research and observations, scientists will come up with a hypothesis. This is a potential answer to the question they have posed at step one using the information and observations they have gathered from past experience as well as any theories they have kicking around. A prediction is then made based on this hypothesis describing what the outcome of the experiment might be. The evidence is then gathered to test the prediction.
In the business context, when we have potentially posed the right question, we will immediately formulate a hypothesis based on our own assumptions. The well-known adage proclaims that a correctly formulated question already contains 50% of the answer. The data we use to test our hypothesis might include customer feedback surveys, market research reports, or industry news articles.
Bolstering our effectiveness at this step is our little friend, the powerful self-service analytics tool, that can breeze through and analyze data from hundreds of sources in order make predictions in a matter of moments.
For example, let’s say you ask it to look at what the outcomes were for companies that launched a similar apple-orange mix over the last five years. Self-service analytics can look at historical data and, using predictive analysis, give you a definitive answer as to whether sales will likely grow or not as a result of this new product.
Steps 3 and 4: Collect and analyze the data
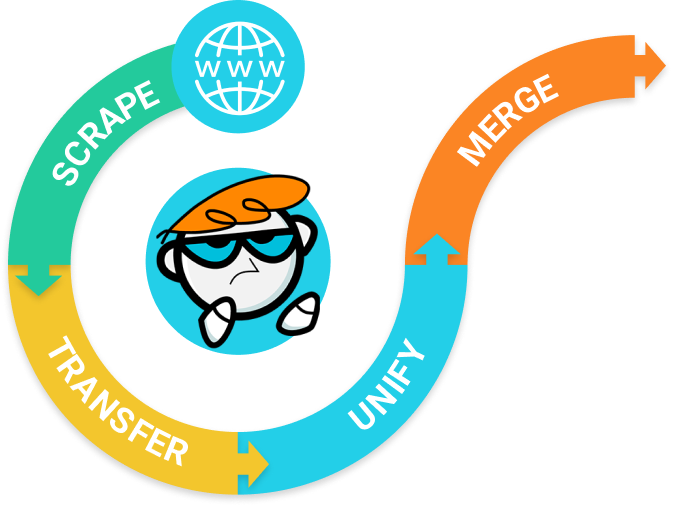
This half-way point is when the “real” analytical work starts. I won’t spend too much time on the subject of data collection; AI will help you map and match data from different sources, data bases and geographical locations. Additionally, e-commerce data scraping may add more value to the analysis–nowadays, you can often get the information in real time. At this step, using AI is simply inevitable, unless you plan to spend the rest of your life in front of the computer matching data from France, for example, with data from Mexico.
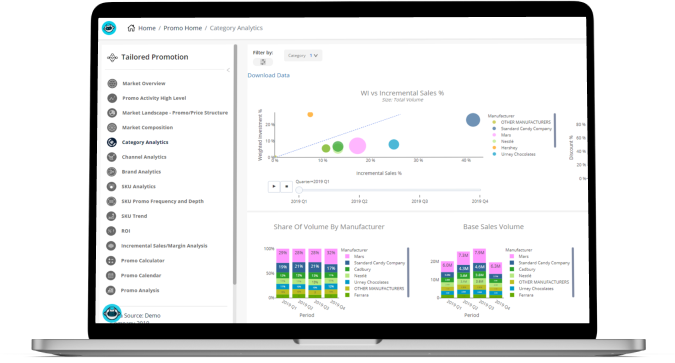
After collecting all relevant data, it’s time for analysis and interpretation of the results. Scientists often set out their data using scientific graphs, useful in comparing elements and displaying patterns, trends or connections between variables that are being tested.
Self-service analytics also provides similar data visualization tools while unlocking insights that would never have otherwise come to light. And there’s no need for specialist technical knowledge to make that happen.
Conversely, many category managers routinely jump straight to number four and bypass the preceding steps. That’s problematic, as it will almost certainly not lead to informed decisions–and that’s the best-case scenario. The worst is that it leads to paralysis and inevitable burn out.
Step 5: Draw conclusions
Did the hypothesis from step two hold up or not? Depending on the results, scientists can decide if the evidence supports their predictions or not. If there’s no conclusive answer, or doubts persist, the process needs a rethink.
But even when there’s a clear answer, and scientists write up their results, they use the conclusions to create new questions to investigate. Then the whole process begins again.
There’s never really an end to analysis, just different stages. Even when decisions are made, progress should be monitored continuously using self-service analytics. Strategies can be adjusted further as the market changes, if the results don’t meet expectations, or when new information emerges.
Building a successful business is a marathon, not a sprint. Don’t I wish I had a dollar for every time I’d heard someone say that! The point is, if you’re in a marathon, you need the right tactics and gear.
Self-service AI–empowered analytics is a powerful tool that should be made available to marketing professionals as it democratizes IT and data access and makes it possible for anyone to conduct analysis and generate insight. That can only lead to better informed decisions–and less anxiety-driven burn-out.
Sure, there needs to be a cultural change in many organizations to make this possible, but that discussion will have to wait till the next blog post!